Using stats to prioritize what to study: 22k hand sample, 2 short-stack leaks I had no idea about
Posting this because I think the "what should I study next?" problem is underdiscussed and stats can solve it more concretely than most people realize.
Background: low/micro stakes MTT grinder, mostly $2-$22 buy-ins on GG, ~1, 250 tournaments over the last few months. The volume is real but the buy-ins are small so take everything with appropriate sample-size grain of salt.
The problem I was running into is the same one I think a lot of recreational+ players hit: there's infinite content available (videos, sims, training sites, threads) and zero way to know which of it actually matters for your specific game. I'd watch a 90-minute video on river overbet construction and have no idea if river overbets were even close to my biggest leak.
So I dumped everything into a tracker (GrindLog — imports PokerCraft directly, segments by stack depth which turned out to be the key feature) and looked at my numbers filtered to <25BB stack depth specifically, since that's where most of the EV gets distributed in MTTs.
Total sample at <25BB: ~22k hands across 1, 254 tournaments.
Two stats jumped out as way outside reasonable ranges:
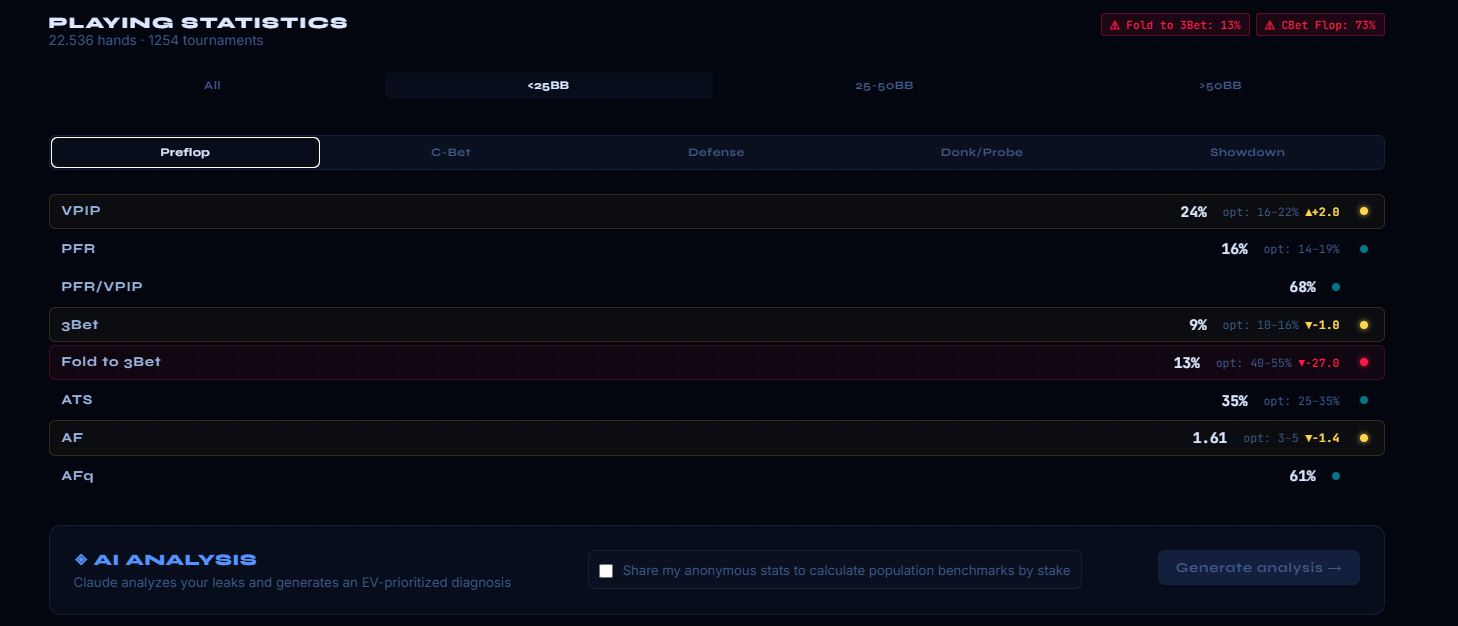
Leak 1 — Fold to 3Bet: 13%
Reasonable range short-stacked is somewhere around 40-55% depending on your opening frequencies and position dynamics. I'm at 13%.
What this means in practice: when I open and someone 3bets me at <25BB, I'm continuing 87% of the time — calling or 4-bet shoving with way too much of my opening range. At those stack depths the 3-bettor's value range is heavy (the implied odds for cold-calling 3bets are bad with low SPR, so people 3bet linear), which means I'm spewing equity against ranges that crush me.
The exact mechanism I think is happening: I open something like KTo from CO at 22BB, BB shoves 12bb on top, and I'm calling getting "decent" odds without actually doing the math on what's in their range. Spoiler: their range is like 88+, ATs+, KQs, AJo+ and KTo is in terrible shape against all of that.
Sample size on this specific stat: opportunities are high (every time I open and face a 3bet) so the 13% number is not a small-sample artifact.
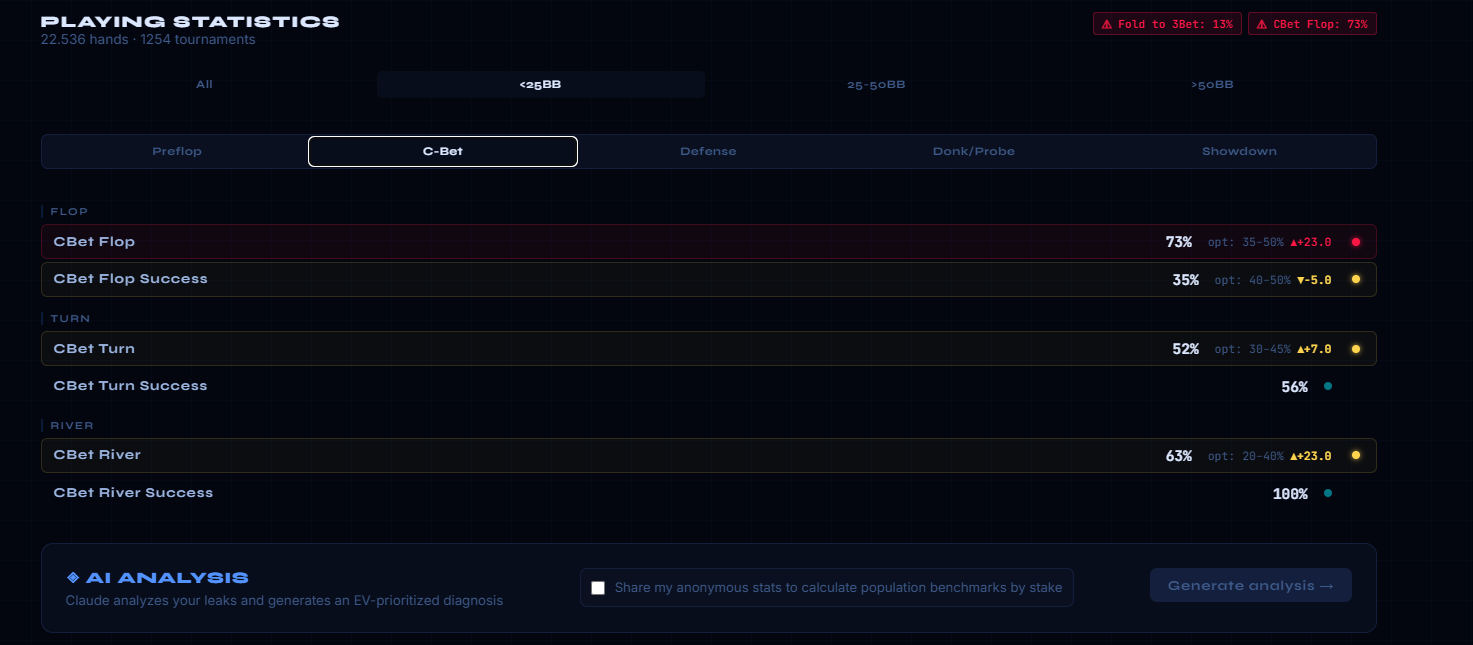
Leak 2 — CBet Flop: 73%
Reasonable cbet frequency at <25BB is around 35-50% depending on board and position. Mine is 73%, with a success rate of only 35%.
The combination of high frequency + low success is the giveaway that opponents have adjusted to my predictability and started floating wider. At low SPR a high cbet frequency is especially bad because you can't credibly barrel turns when called, so all you've done is bloat the pot with hands that have no equity to realize.
Root cause is autopilot: I raise pre, I get called, I cbet flop because that's what you "do" with initiative. No actual thought about whether the board favors my range, whether the villain's flatting range crushes my hand specifically, whether I have a turn plan if called.
Why I'm sharing this
The point isn't really "look at my leaks" — it's that I would NEVER have identified these by intuition or memory. I had a vague sense I was "spewing" but if you'd asked me to name my biggest leak before doing this exercise I would have said something completely different (probably bubble play, which turned out to be relatively fine).
Stats-driven study selection feels much more efficient than the "watch the video everyone is talking about this week" approach. Spending the next month on solver work specifically for short-stack 3bet defense and selective cbetting will have way more EV impact than another 20 hours on something that wasn't actually broken.
Open questions for the forum
A few things I'd genuinely like input on from people more experienced than me:
For those of you who track stats seriously — how do you decide what's a real leak vs. what's just a reasonable deviation from "GTO" frequencies that might still be EV-neutral or even +EV exploitatively? I assume some of the "reasonable ranges" I'm comparing against are themselves just population averages that might not be the real solver baseline.
Is fold-to-3bet a good standalone metric, or should I be looking at it segmented by 3-bettor position, stack depth of the 3-bettor, and my opening position? My gut says yes but the sample sizes start getting thin.
For cbet frequency at low SPR, is there a more useful metric than raw % — like cbet by board texture or by SPR bucket? My tracker breaks down some of this but I'm not sure which slice is most actionable.
Curious to hear what others have found when they've gone through this exercise. And if anyone wants to compare numbers I'm happy to share more. [image]J0DZh7Y.png[/im
[image]4E0cqaI.png[/im
..] ..]
1 Reply
Hey, definitely agree that database review is one of the most useful techniques to highlight blindspots and structure your study.
However, the target frequencies in the tool you are using seem way off. I would not recommend trying to follow these. One of the issues could be that the stats are too vague. For example, cbet flop should be at least filtered for when you are in/ out of position since those two situations play vastly differently (you cbet much more in position). Looking at a flop report for HJ vs BB 20bb, cbet should be around 85% while HJ vs BTN is around 35%, so your overall 73% actually looks reasonable. That said, with more analysis, you could discover some positional, textural or sizing leaks.
Fold to 3bet I would like to see broken down at least into vs allin/ non-allin 3bets, but in any case at 13% that is almost certainly a leak and you could practice calling reshove ranges to help with it.
To answer your other question, you can see if something is a good deviation by tracking its EV or how the population react. For example, if you are trying to open the BTN excessively wide, you could see how often your opponents are folding in the blinds. You can also filter for that situation (opening non-GTO hands on the BTN) and see if you are +EV or -EV over your sample.
Thanks, this is exactly the kind of feedback I was hoping for.
You're completely right about the CBet Flop number being misleading without positional context. I was aggregating across all scenarios and comparing against a single "healthy range" which obviously doesn't hold up once you split by position. 85% cbet HJ vs BB and 35% HJ vs BTN averaging into a single 73% bucket tells me basically nothing actionable — it could be perfectly fine or it could hide a real leak in one specific branch. Going to rework the stat to segment by (hero position, villain position) at minimum, and probably add board texture on top of that since a dry A-high flop and a wet connected board also play nothing alike.
The fold to 3bet point is well taken too. At <25BB a large chunk of the 3bets I face are shoves, and "fold to 3bet shove" and "fold to non-allin 3bet" are completely different decisions — one is a pot-odds + equity calculation against a shove range, the other is a postflop playability question. Lumping them is hiding which one is actually broken. Going to split it.
On the EV tracking suggestion — that's a great framework and honestly the thing I've been missing. Comparing raw frequencies against "target ranges" is kind of a dead end because the targets depend on so much context. Tracking EV on specific situations (e.g. my opens from a particular position that fall outside the standard range) and seeing whether the sample is +EV or -EV over time is way more honest. Going to think about how to implement that without it being noisy from variance.
Appreciate the detailed response. Going to go actually practice reshove defense ranges — 13% fold to 3bet short stacked is almost certainly me not knowing the math against specific shove ranges rather than me "choosing" to call wide.
Quick update on the rework — shipped most of what we discussed.
CBet Flop is now segmented by board texture × position. Five texture categories (dry, semi-wet, wet, paired, monotone) split by IP/OOP for heads-up pots. So instead of one misleading 73% number, you now see things like "dry IP: 75%, wet IP: 73%, monotone IP: 79%" — which immediately shows that I'm barely adjusting frequency across textures when the spread should be ~30 points.
Also added a separate multiway cbet breakdown since cbetting into 3 players is a completely different decision than HU. The benchmarks are substantially lower (e.g. 25-40% on wet boards multiway vs 40-55% HU).
Fold to 3bet is now split into vs all-in and vs non-allin, exactly as you suggested. At short stacks most of the 3bets I face are shoves, and the two decisions are fundamentally different — pot odds + equity math vs postflop playability.
3bet and fold-to-3bet now have positional matchup breakdowns (e.g. SB vs BTN, BB vs CO). Also fixed a bug where short-handed tables in late stage MTTs were generating impossible matchups like "HJ 3bets vs BTN opener" — the position labels were collapsing when the table had fewer than 6 players.
Push/fold analysis at ≤15bb tracks push, limp, and min-raise frequencies by position with Nash chipEV reference ranges. Showed me I was limping 3% from BTN at short stack — not a huge number but it should be close to zero in most spots.
Haven't implemented the EV tracking per situation yet — that's a harder problem (variance makes small samples noisy and I need to think about how to present it honestly without false confidence). On the roadmap though.
Works with GGPoker hand history .txt files: grindlog.app
If anyone wants to try it and give feedback on the stat definitions or benchmarks, genuinely interested — the exchange we had here is exactly what led to this rework.


