Look at my PLO graph and help me comprehend it
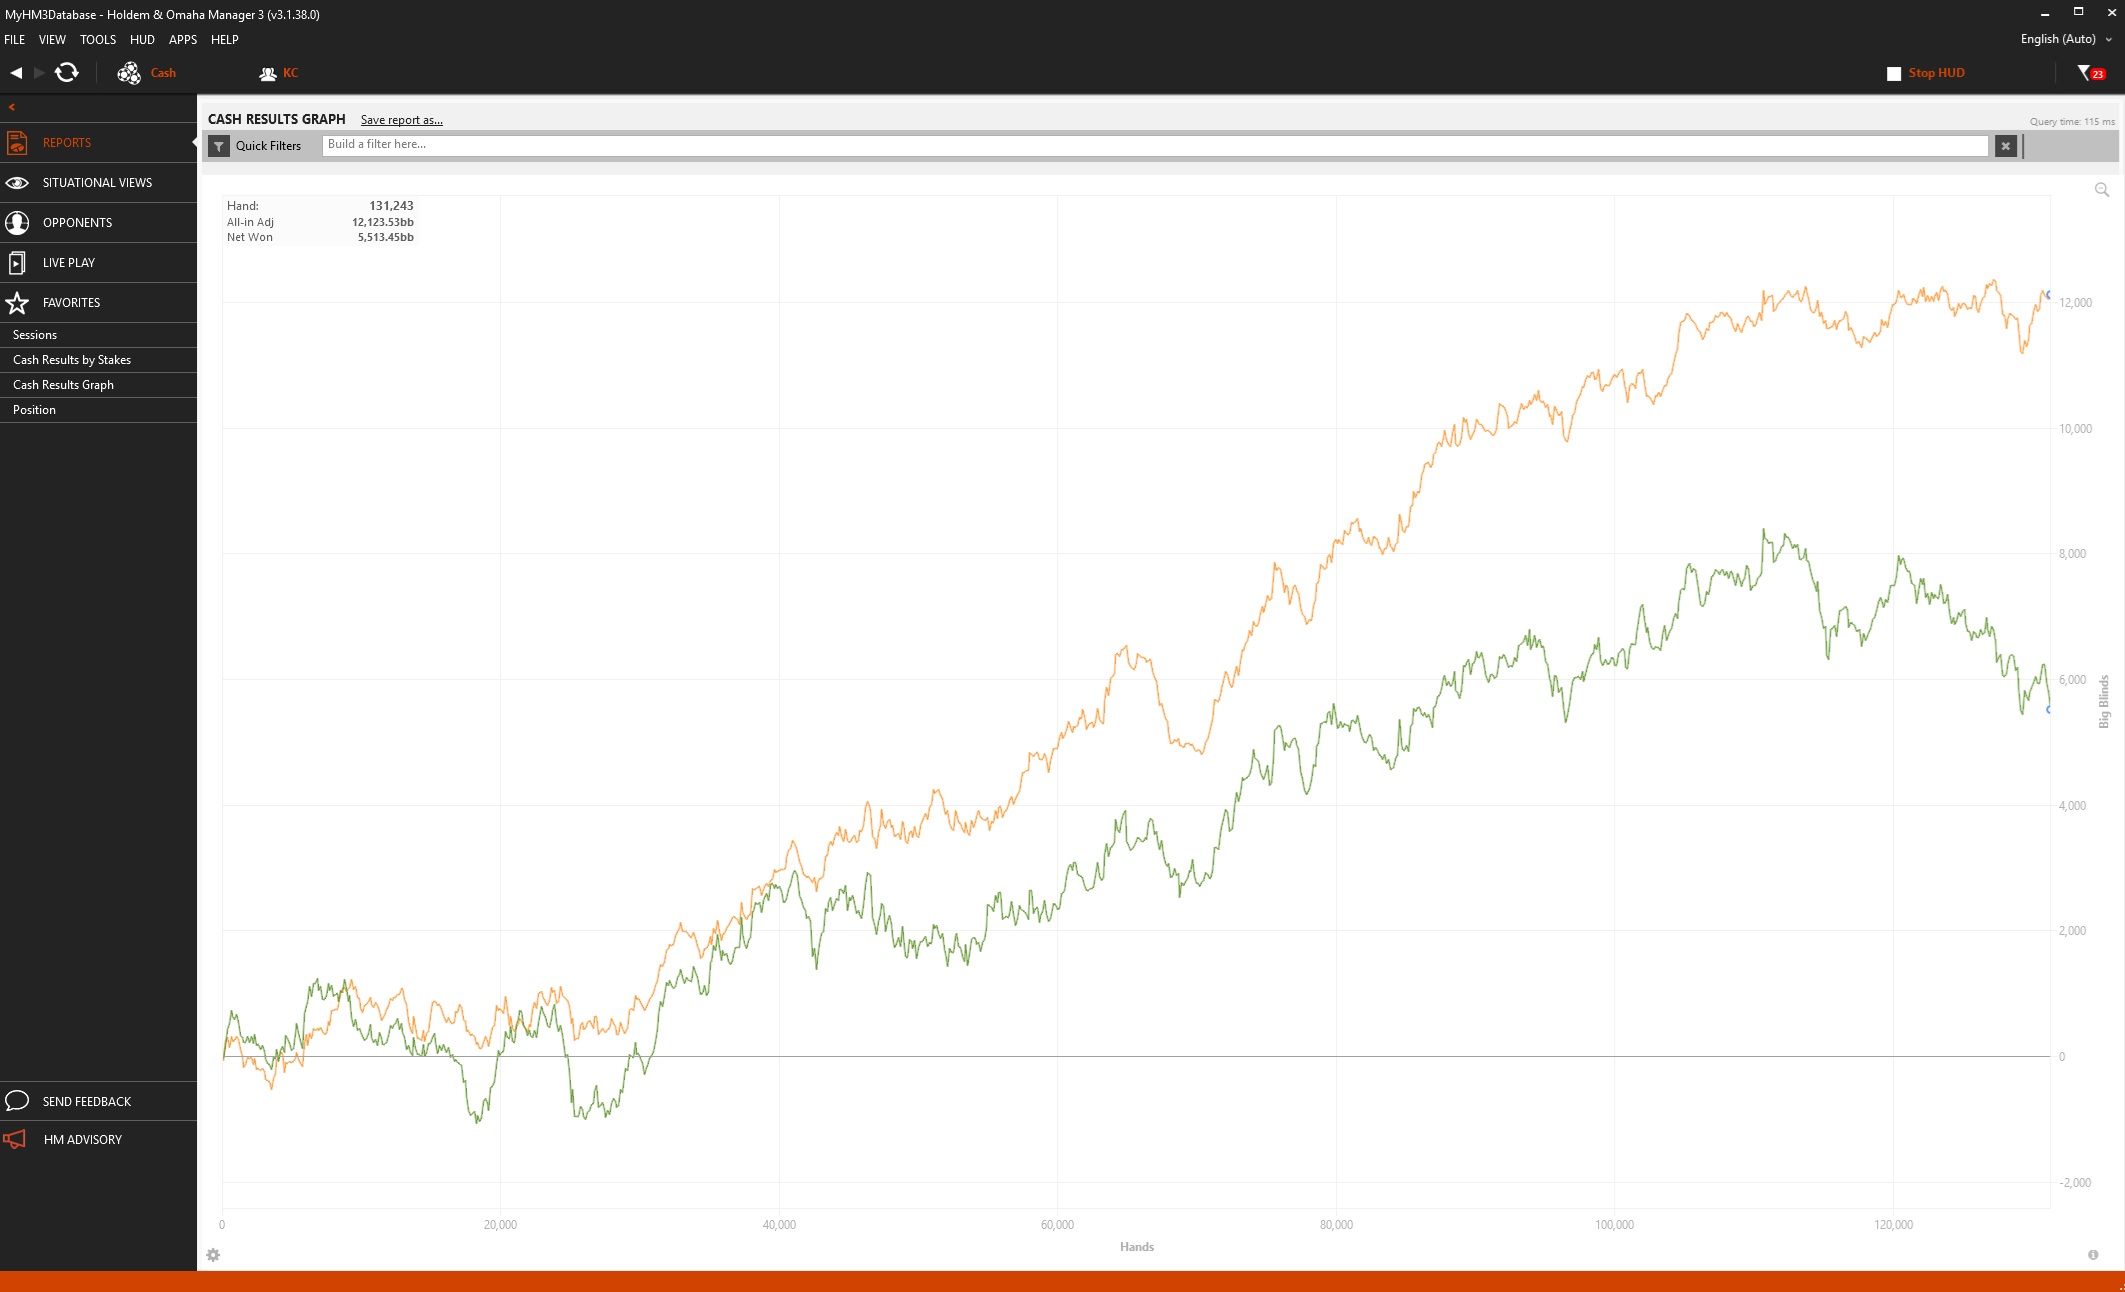
This graph is all PLO on US legal sites. I'm in PA, so Pokerstars and BetMGM. I've clicked to just over 66 buyins below EV over 131k hands. Stakes ranging from $1/$2-$25/$50 PLO. I'm simply at a loss right now, have PTSD every time I sit down at my computer. Can anyone help me understand that math on this? Is this within reasonable variance, what percent outcome am I seeing here? The worst part of this for me is this graph spans over 2-3 years. The PA market is brutal, not much volume to be had. The games go when there is a fish and then break immediately
5 Replies

There's a reason why they call it the devils game. Think it's pretty normal, used to play PLO and there are periods, where nothing is going your way. 20bi under EV a session is nothing.

Welcome to the forums. Next poast in 2041?
Well, 66 BI below EV looks disgusting to me, but I don't play PLO. It might even be somewhat normal, as B1ochemical said. Maybe the folks in Omaha can give you a more detailed response.
The EV-line only explains something like 20% of your variance, so I wouldn't pay too much attention to it. You ran bad in all-in spots, but you probably ran good in other spots.
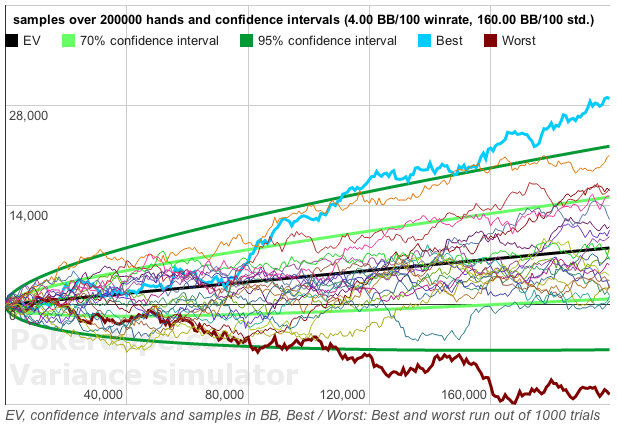
Poker variance calculator is a good tool for understanding omaha's variance.