Is is possible to calculate the average EV gain/loss for common scenarios?
Say you break the game down into its most basic components. a.k.a:
- Preflop
- SRP
- 3BP
- 4BP
- 5BP
Is it possible to calculate the average EV gain (of say, the top 10% of winning players in any given pool) for each scenario as a totality and then compare them?
(i.e. fish in SRP lose on average 20% more EV compared to GTO vs their pool. Whereas in 3BP they only lose 10%. etc)
That would produce a useful map for players to focus attention while training i think? And you could extend it out to all theory categories.
Has this been done? It would be nice to have solid data on such things because life is short.
8 Replies

Say you break the game down into its most basic components. a.k.a:- Preflop- SRP- 3BP- 4BP- 5BPIs it possible to calculate the average EV gain (of say, the top 10% of winning players in any given pool) for each scenario as a totality and then compare them?(i.e. fish in SRP lose on average 20% more EV compared to GTO vs their pool. Whereas in 3BP they only lose 10%. etc)That wo
I think Hand2note can show you "EV" (hard to call it EV when it's the money that was actually made on average, not some expectation) in a given spot, so yea i think this can be done. You could also just compare winrates
The problem with filtering the 10% most winning players in any given pool though is that you are filtering towards the 10% luckiest players, so you will probably see some insane winrates in all kinds of spots.
Another issue is that positional+spot winrates are extremely hard to get a sample on
You can do EV line sampling for preflop nodes in HRC given a solved preflop set. For example, you could see what EV SB vs BB SRP is or similar.
Ok. So keeping it simple and using WRs, here is a winning sample from my microstake DB:
75k hands
WR: 7bb/100
SRP: 74bb/100
3BP: 135bb/100
4BP: 655bb/100
5BP: 1100bb/100
This would suggest 3BPs are about twice as lucrative as SRP? And 4BPs 3x more so?
Is there any merit to dedicating a proportional amount of time + energy to these rarest but most profitable scenarios? I.e. is it worthwhile mastering 3b pots with about double the study time of SRPs?
[Excluding 5BPs because they are all-ins and harder to **** up using basic practices. And over studying 4BP for the tiny fraction they occur seems counterintuative also.]

Ok. So keeping it simple and using WRs, here is a winning sample from my microstake DB: 75k hands WR: 7bb/100 SRP: 74bb/100 3BP: 135bb/100 4BP: 655bb/100 5BP: 1100bb/100 This would suggest 3BPs are about twice as lucrative as SRP? And 4BPs 3x more so? Is there any merit to dedicating a proportional amount of time + energy to these rarest but most profita
You have to weight these numbers according to how often each one occurs. For example

A while back I was working on a "Spot Importance" project that attempted to quantify the value of studying different formations by multiplying the pot size and frequency of every postflop formation (using 100bb preflop sims).
Assuming you perform equally well on all spots, you end up with these priorities:
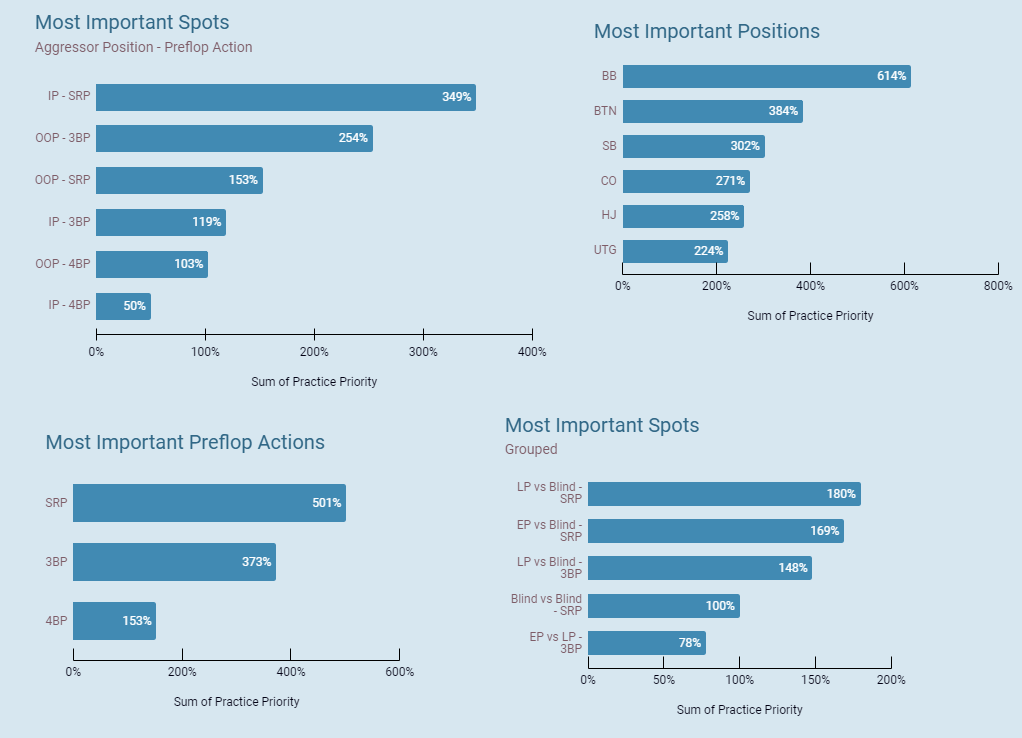
Unsurprisingly, SRP > 3BP > 4BP.
Here are the most important formations (note the order varies a bit depending on RFI size and rake, but it's always the IP vs BB SRP first).

What frequency means? What EV means?
If you add up all freq its way less then 100%(I guess BTNvBB srp is 5% of all hands including hands that dont see flop) EVs added up are way more then 100%?
Cheers tombos that's brill.
Agreed my EV approach is muddled and impractical.. Freq * pot a more realistic measurement.
For my drug addled-mind I put those figures into this pie chart I may as well post:

Particularly useful because I didn't realise how much more 3BP OOP > 3BP IP. Nor how important 4BPs are in the wider scheme. Excellent.
What frequency means? What EV means?
If you add up all freq its way less then 100%(I guess BTNvBB srp is 5% of all hands including hands that dont see flop) EVs added up are way more then 100%?
- Frequency = how often a HU postflop formation occurs
- EV = pot x frequency
Frequencies add up to less than 100% because lots of pots get taken down preflop. You can't really classify a spot as "BTNvBB SRP" if you don't see a flop.
The methodology is outlined in this video (starting at
)
Cheers tombos that's brill. Agreed my EV approach is muddled and impractical.. Freq * pot a more realistic measurement. For my drug addled-mind I put those figures into this pie chart I may as well post: Particularly useful because I didn't realise how much more 3BP OOP > 3BP IP. Nor how important 4BPs are in the wider scheme. Excellent.
Ahh yeah this is a nice visual.
I think it would be interesting to compare GTO to a database of 6max hh
