Biggest loser in online poker history wants to grind $16k
I start this with some pictures:
nl2 -$8792.18 -82 buy ins below EV
nl5 (notice that pt4 shows party poker nl5 as nl4)
Another month with massive suckouts. 38 suckouts in range of 65-99% equity meaning total loss of $300 with best hand.
3x 90%+ equity suckout
11x 80-90% equity suckout
13x 70-80% equity suckout
11x 65-70% equity suckout
Show me your graph with this amount of suckouts before saying anything about normal variance. Graph and hands like I do, it's so simple. Then show me positive graph with this amount of losses with best hands. That is easy too if you say it's normal and everyone can do it.
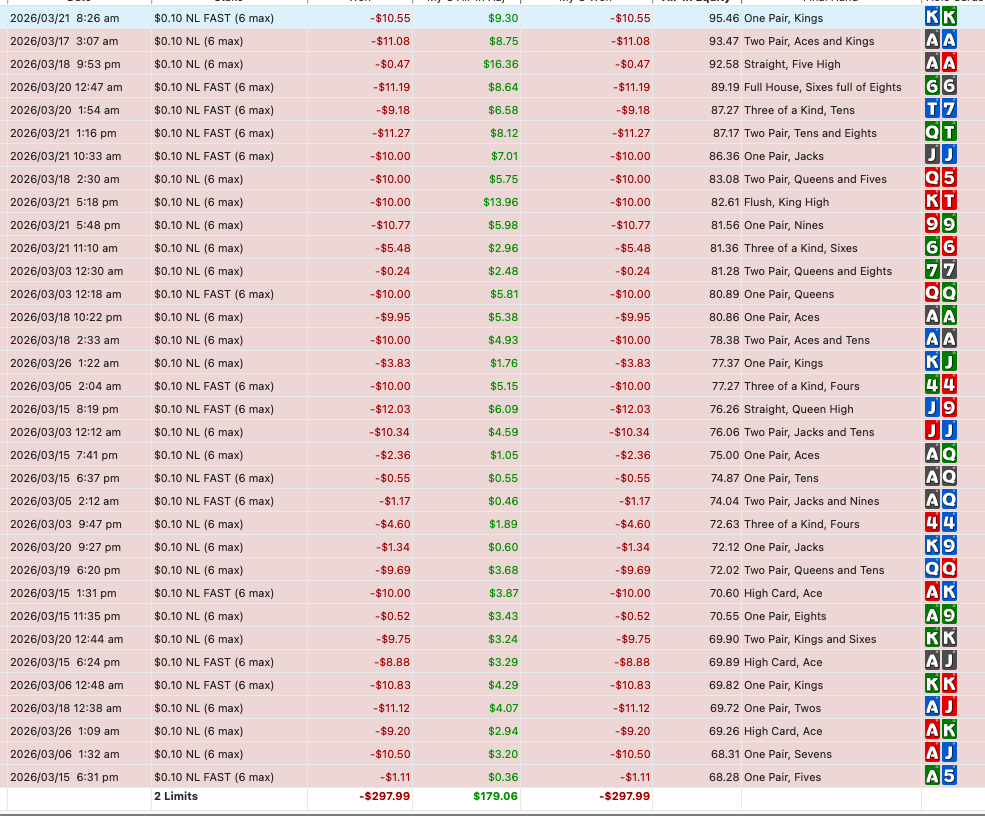

Another month with massive suckouts. 38 suckouts in range of 65-99% equity meaning total loss of $300 with best hand. 3x 90%+ equity suckout11x 80-90% equity suckout13x 70-80% equity suckout11x 65-70% equity suckoutShow me your graph with this amount of suckouts before saying anything about normal variance. Graph and hands like I do, it's so simple. Then show me positive graph
so you lost $300 due to bad variance, where did the other $2000 go?
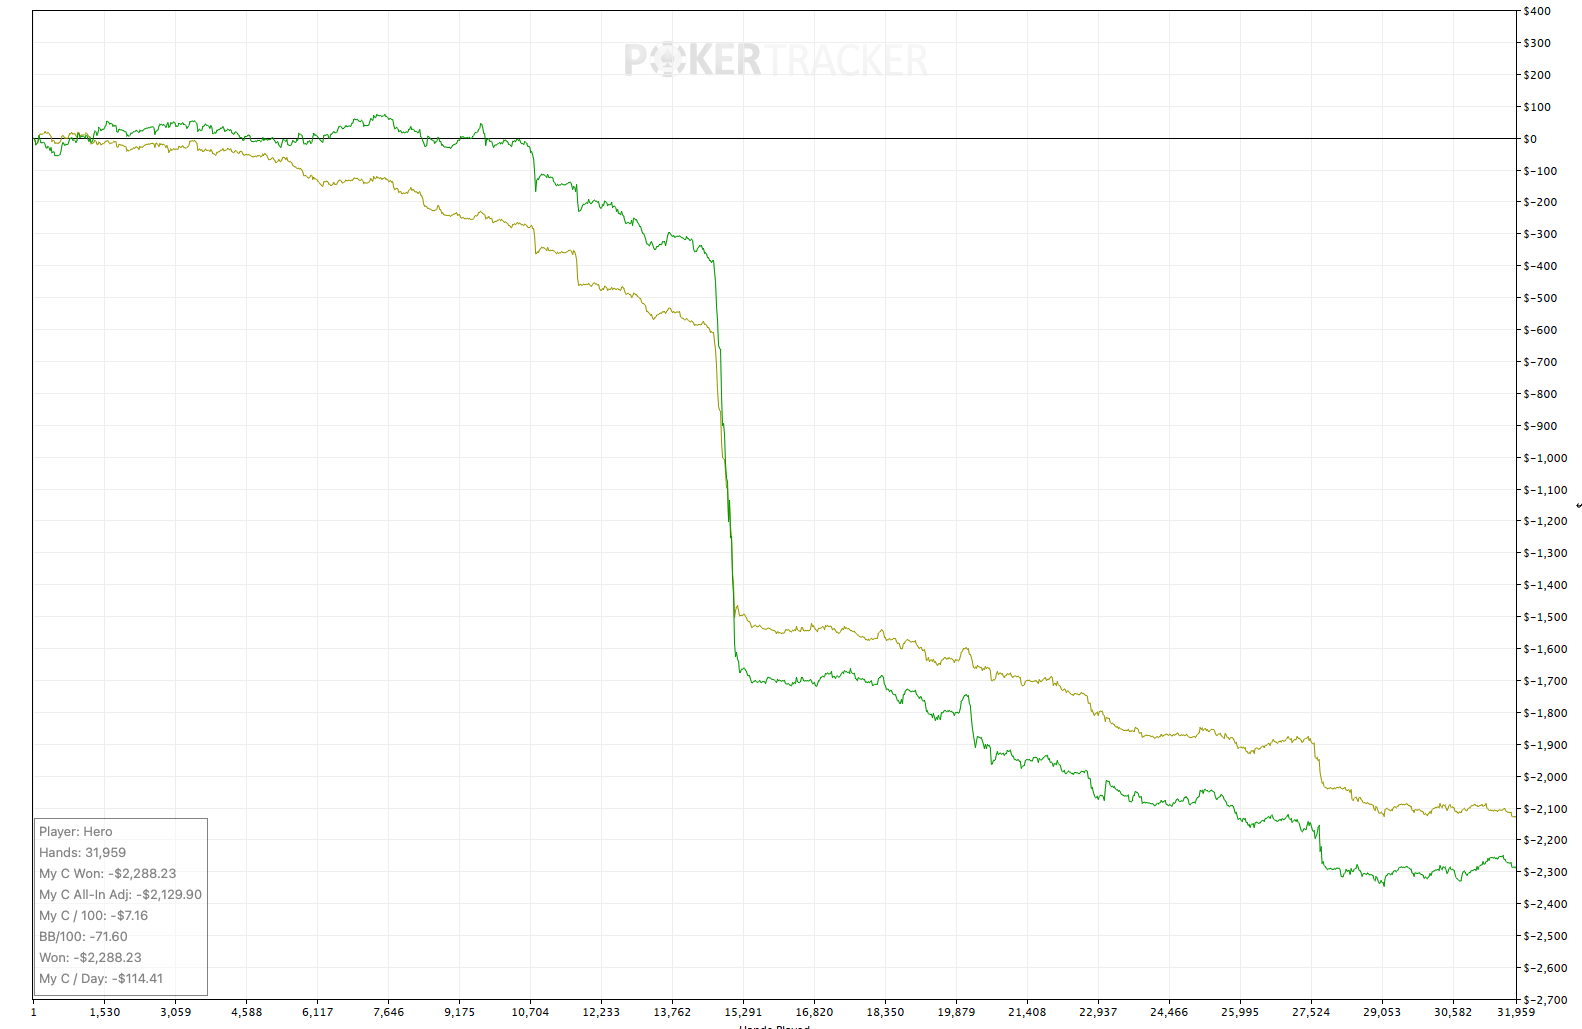
So what's the deal with that $1300 drop in the middle there?

Guys, look at his bb/100 in the bottom left corner, he really lost 130 buy ins in those couple of hands.
At this point he's literally braindead i reckon.
@paisting do u accept you have tilt issues? In that ive noticed you actually have break even spells each month but then ridiculously bad spells also. This can realistically only be due to tilt.
If you admit that you do then its hypothetically fixable. If you dont, its not. I and i suspect many others, would help for free if you just admit this. Not to embaress you but because any help would be worthless unless you are willing to admit faults and listen to advice.
His bb/100 loss rate is exactly the same amount of money for nl10. Only god knows how he managed to lose so much in a few hands.


That drop is statistically impossible. He must have raised 99bb preflop and folded to a shove in every hand.
That drop is statistically impossible. He must have raised 99bb preflop and folded to a shove in every hand.
Doesn't seem impossible to me. When Paisting open shoves and gets called, his equity is something like 30%. Therefore if he shoves a hundred times in a row, he is expected to win 30 times and lose 70 times, making a net negative of -40 buy-ins. In this case he seems to have shoved about 500 times in row.
I bet the other players at the table must have had an unforgettable session.

Doesn't seem impossible to me. When Paisting open shoves and gets called, his equity is something like 30%. Therefore if he shoves a hundred times in a row, he is expected to win 30 times and lose 70 times, making a net negative of -40 buy-ins. In this case he seems to have shoved about 500 times in row.
Well he was running under EV so he did what was neccesery to reverse the lines #RNGFixed.
Doesn't seem impossible to me. When Paisting open shoves and gets called, his equity is something like 30%. Therefore if he shoves a hundred times in a row, he is expected to win 30 times and lose 70 times, making a net negative of -40 buy-ins. In this case he seems to have shoved about 500 times in row.I bet the other players at the table must have had an unforgettable session
Then show me the 30% profits with his all-ins in the graph. The graph goes strictly downwards – I have no idea why so many people don't understand that it's mathematically impossible to lose 150 buy-ins without winning in between (if he won just 10% of the all-ins, you'd see it in the graph). The $1500 loss comes from him switching to 200NL. Paisting is a mentally challenged liar, and it's simply ridiculous that it's not recognized that Paisting's graphs are impossible on 10NL.
Then show me the 30% profits with his all-ins in the graph. The graph goes strictly downwards – I have no idea why so many people don't understand that it's mathematically impossible to lose 150 buy-ins without winning in between (if he won just 10% of the all-ins, you'd see it in the graph). The $1500 loss comes from him switching to 200NL. Paisting is a mentally challenged li
But you can see it, that thicker green line is going up and down, sometimes. He gets deeper and everybody around him, maybe he gets to 400 or 800bb stack, but somebody else will get that deep and then he loses eveything in one hand.
He Open Shoves for about 500 hands. If he lost all of them, he would have lost 500 buy-ins, but in reality he lost 130 buy-ins, which means he won about a third of the hands.
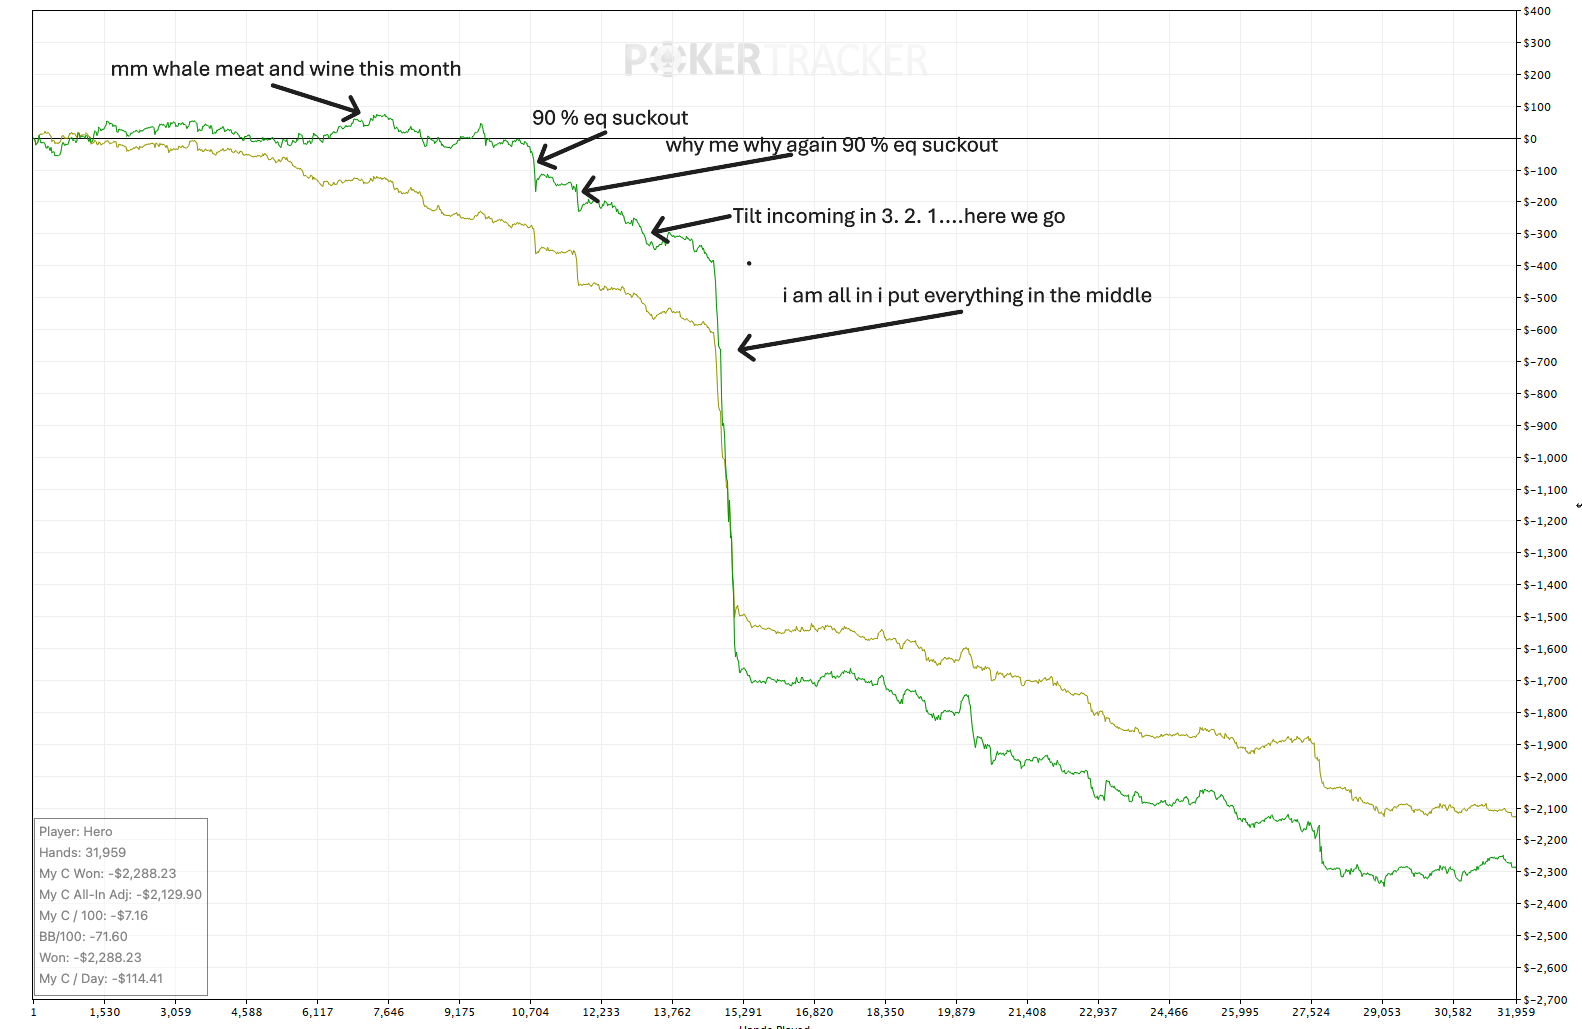

bb/100 and money lost, the math for that works out. Are you not capable of calculating this? Do you need help for that?
bb/100 and money lost, the math for that works out. Are you not capable of calculating this? Do you need help for that?
In the age of AI, it's extremely difficult to fake a number like that in the graph—should I explain how it's done? But you know-it-all can gladly show me how to lose 150 all-ins in a row with a 30% to 70% probability without the graph even rising once.

